Post-Election Analysis
Introduction
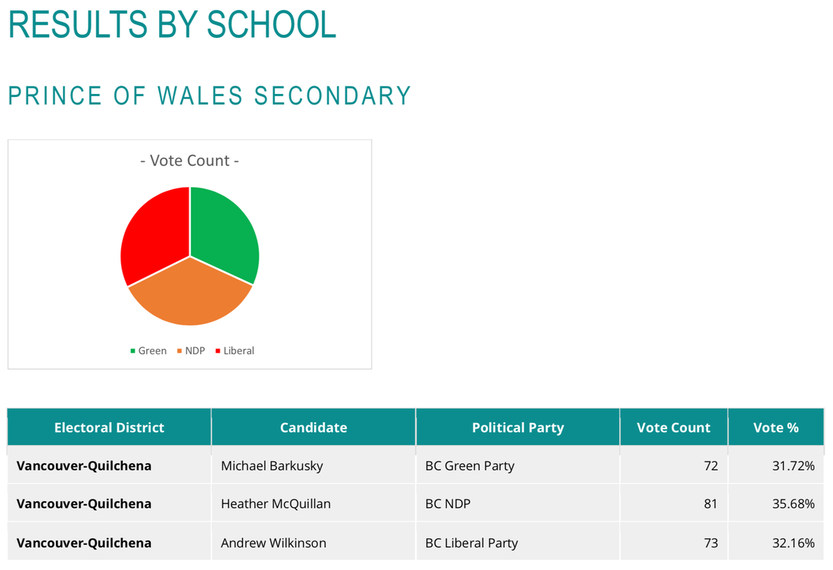
Here are our school's results. Who won the most number of votes? Was it a close race?
Here are our school's results. Who won the most number of votes? Was it a close race?
Activity One - Looking at the results
- Compare the results of your school's election with the results of other schools in your electoral district. Are they similar or different? Is this surprising? Why or why not? Which candidate won in your electoral district in Student Vote?
- Using the province wide Student Vote results, answer the following: Which party attracted the greatest support? Which party won the most seats and formed the government? Are you surprised with the Student Vote results?
- How do you feel about your participation in Student Vote? Would you like to participate again? What did you learn through the experience?
Activity Two - Essential Concepts
- View the following slide deck or video to answer the following:
- How many seats are there in the provincial legislature? How many seats does a party need to win in order to achieve a majority government?
- What is the cabinet? What do cabinet ministers do?
- How is legislation passed?
Activity Three - Results Comparison
- Complete ACTIVITY SHEET 9.1
Conclusion
- Which parties gained or lost seats? Why?
- Were there any big surprises or upsets in the election results?
- Did the Student Vote results reflect the general election results? Why or why not?
- Which type of graph works best for displaying election results (e.g., pie chart, line graph, bar chart)?
